May 5 - 9 notes
ddRADseq
Worked with SHC throughout week on ddRADseq trouble-shooting.
Scott Tighe at sequencing center recommended PCR prior to size selection. When start with low-input DNA, very little left after size selection and purification which can introduce extra bias. Also can attempt size selection using AMPure beads only by varying ratio of beads
- Confirmed DNA in size selection gel, but very low recovery
- Nothing amplified after PCR
- PCR on pooled sample immediately after ligation also did not amplify
- did ligation work?
ApTranscriptome
BLAST hits
Made Krona chart of species distribution of BLAST hits from Aphaenogaster transcriptome. Made using the hits2nr_tab.txt BLAST table from FastAnnotator. Note that this includes the contaminant sequences.
- 47% of 55,432 annotated transcripts are Insecta.
- Of these, 79% are Hymenoptera (37% of total)
- Of these 93% are Formicidae (34% of total).
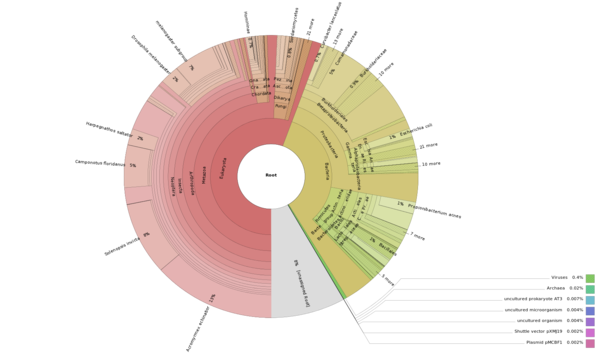
Aphaenogaster Krona chart here
The large number of hits to Bacteria could be due to Krona simply taking the top BLAST hit, even if there’s a more biologically-relevant hit further down the list.
For comparison, the Chrysopa transcriptome (Li et al. 2013) found about 62% of 21k “unigenes” to have a best hit to Insecta.
Li, Z.-Q., Zhang, S., Ma, Y., Luo, J.-Y., Wang, C.-Y., Lv, L.-M., Dong, S.-L. & Cui, J.-J. (2013). First Transcriptome and Digital Gene Expression Analysis in Neuroptera with an Emphasis on Chemoreception Genes in Chrysopa pallens (Rambur). PLoS ONE, 8, e67151.
Reactionome
Based on last week’s discussion, proceed with gene expression quantification using the ‘contaminated’ transcriptome and remove those transcripts from the analysis.
Merged git branches to return to previous version - decided to update Sailfish to version 0.6.3 as this is the version available at time of publication Patro et al. 2014
Ran into previous problem with /opt/software/Sailfish-0.6.2-Linux_x86-64/lib/libz.so.1: no version information available. Solved as before by removing the version of liz.so.1 packaged with Sailfish. Note that I was not the only user with this problem.
New version of Sailfish has some changes - allows for paired reads during quantification. Unfortunately, can only specify single end (SE) or paired end (PE) reads. As I have both orphaned SE and PE reads, just ran all four files as SE, similar to what I had done before. Asked about this on user group.
After re-running analysis as before, running new version of Sailfish, back to what I started - testing if the temperature that expression is turned “on” for thermally-responsive transcripts differs among colonies. I implemented this by looking at the change in temperature from one temperature to the next, and selecting the temperature value at which the greatest change occurred. Or in R:
T_on <- subdf[median(which(diff(subdf$TPM) == max(diff(subdf$TPM))))+1, val]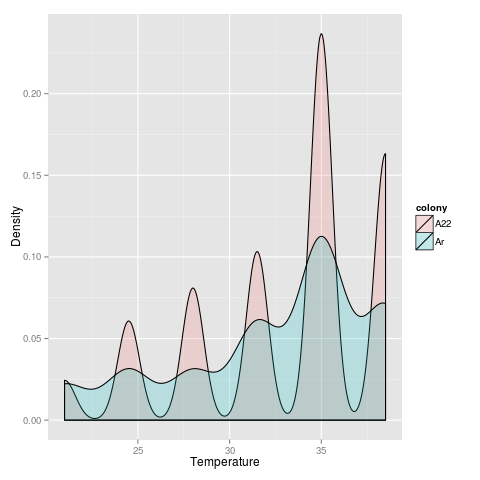
Not sure about the waviness in A22 - something with the diff function?
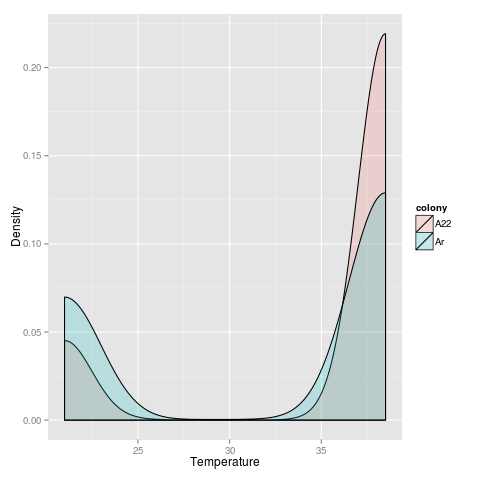
Because I’m fitting a quadratic, this pulls the maximum rate of change towards the ends of the range examined.
In both cases, a T test shows that A22 has an overall significantly higher temp at which expression is increased.
