ddRADseq round 2 summary
Samples
DNA was extracted from 3 ants each from 6 lab colonies of Aphaenogaster.
| sample | colony | conc_extraction | total_dna |
|---|---|---|---|
| T1 | EW205 | 42.4 | 1696 |
| T2 | EW110 | 60 | 2400 |
| T3 | 2012A1 | 29.1 | 1164 |
| T4 | DG23 | 58 | 2320 |
| T5 | 20130818-Mike | 34.9 | 1396 |
| T6 | EW20 QR | 35.2 | 1408 |
Combined total DNA ~ 1.0384 × 10⁴ ng
Double digestion
50 ul rxn volume following NEB protocol
| Reagent | Volume (ul) |
|---|---|
| NlaIII | 1 |
| MluCl | 1 |
| DNA | 40 |
| CutSmart Buffer | 5 |
| H2O | 4 |
3 hr digestion at 37°C.
Included “T7” Control sample of dH2O only.
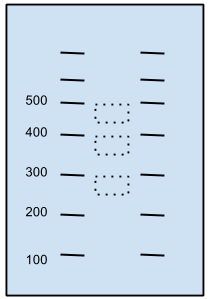
Ln 1, Ap001, is genomic DNA. Note smear above largest marker and no/very little DNA within assay range.
Ln 2 - 6 are double-digested samples. Looks like digest worked well for all samples as concentration in the 180 - 220 bp window ranged from 0.84 - 3.64 ng/ul.
AMPure Bead Purification
- added 75 ul AMPure Beads to the 50 ul rxn. Incubated 5 min room temp
- 2 min on magnetic plate. removed solution
- added 200 ul 70% ethanol (fresh). removed. repeat
- off plate, added 40 ul H2O. 1 min
- on plate 2 min. transfered solution to new plate
Quantified DNA using Qubit.
| sample | conc_extraction | conc_digestion |
|---|---|---|
| T1 | 42.4 | 10.9 |
| T2 | 60 | 24.5 |
| T3 | 29.1 | 5.19 |
| T4 | 58 | 10.2 |
| T5 | 34.9 | 5.82 |
| T6 | 35.2 | 2.1 |
| T7 | 0.13 |
- DNA recovery is low, only 20.7674% on average.
- Positive correlation between the input DNA and DNA after digestion.
- T7 is the blank control - note low-level DNA contamination.
##
##  Pearson's product-moment correlation
##
## data:  conc_extraction[1:6] and conc_digestion[1:6]
## t = 2.712, df = 4, p-value = 0.05344
## alternative hypothesis: true correlation is not equal to 0
## 95 percent confidence interval:
##  -0.0195  0.9777
## sample estimates:
##    cor
## 0.8048
## pdf
## 2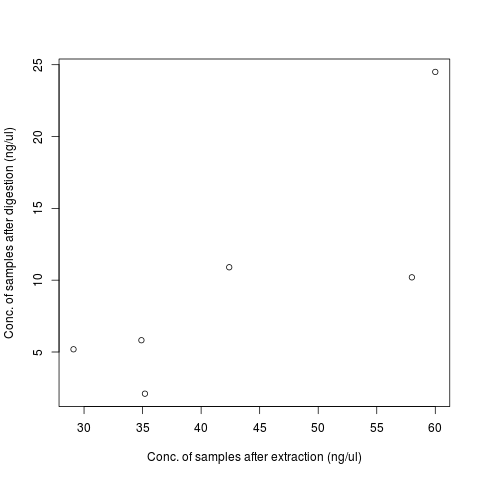
Ligation
Input 100 ng total DNA from each sample for ligation. Volume of each sample to use as input for ligation reaction:
| Sample | Volume DNA (ul) |
|---|---|
| T1 | 9.2 |
| T2 | 4.0 |
| T3 | 19.3 |
| T4 | 9.8 |
| T5 | 17.2 |
| T6 | 47.6 |
| T7 | 40.0 |
For each sample, combined DNA with adapter and T4 ligase. Determined concentration of adapters using ligation molarity calculator. Made fresh working stock of the universal adapter P2. Rather than make a working stock for each adapter P1, just used 0.5 ul of adapters P1.1 - P1.7 for samples T1 - T7, respectively. Made master mix of universal adapter P2 following worksheet.
| Reagent | Volume (ul) |
|---|---|
| DNA | see above |
| T4 mix | 4 |
| P1 (4uM) | 0.5 |
| P2 mix | 3 |
| H2O | to 50 ul |
| sample | Digestion conc | Ligation conc |
|---|---|---|
| T1 | 0.32 | 1.12 |
| T2 | 2.9 | 0.28 |
| T3 | 1.5 | 0.07 |
| T4 | 0.9 | 1.78 |
| T5 | 1.4 | 0.99 |
| T6 | 0.7 | 5 |
| T7 | 1.7 |
No correlation between Bioanalyzer concentrations for samples before and after ligation.
##
##  Pearson's product-moment correlation
##
## data:  bioan_digestion[1:6] and bioan_ligation[1:6]
## t = -1.173, df = 4, p-value = 0.3058
## alternative hypothesis: true correlation is not equal to 0
## 95 percent confidence interval:
##  -0.9340  0.5185
## sample estimates:
##    cor
## -0.506
## pdf
## 2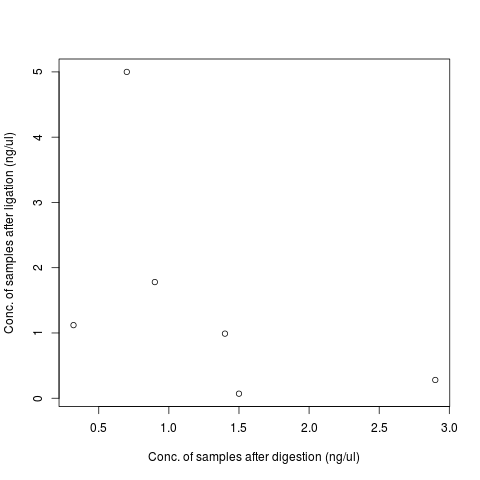
Size selection
- Pooled 40 ul of each ligation in single 1.5 ml tube, leaving ~ 10 ul for diagnostics.
- AMPure bead purification - modified rack method using 96-well magnet plate
- Total pool volume 320 ul.
- 480 ul AMPure beads
- Two washes with 500 ul 70% EtOH
- Eluted in 30 ul H2O
- Size selection
- ran gel for 2.5 hrs at 120V.
- To size select (1) 200+-20 bp, (2) 300+-20 bp, (3) 400 +- 20bp, had to account for 76 bp of adapter sequence. Cut gel pieces 250 - 300 bp, 350 - 400 bp, 450 - 500 bp
- QIAquick purification, eluting in 12 ul H2O
| Sample | descrip | Conc |
|---|---|---|
| P1 | Pooled - size 200 | 0.18 |
| P2 | Pooled - size 300 | 0 |
| P3 | Pooled -size 400 | 0.01 |
Very little to no DNA in each pooled size selection.
Possible places DNA lost
- pooling
- gel extraction
