Summary of Aphaenogaster transcriptome assembly and gene expression analysis
Samples
A22: Aphaenogaster picea from Molly Bog, VT
Ar: putative Aphaenogaster rudis from North Carolina. Bernice thinks may not be rudis based on morphology
From each colony, 10 ants were haphazardly sampled at 1pm and placed in glass vials which were then submerged for 1 hour at one of twelve temperatures; 0 - 3.5 - 7 - 10.5 - 14 - 17.5 - 21 - 24.5 - 38 - 31.5 - 35 - 38.5 Celsius; randomly assigned to each day.
mRNA was extracted from three pooled ants using a double extraction protocol of an RNAzol (Molecular Research Center) and then a RNeasy column extraction (Qiagen) following standard recommendations with the exception of doubling the DNAse for the RNeasy extraction. Approximately 100-300 ng of mRNA was extracted per ant (Nanodrop).
Agilent Bioanalyzer QC for the samples indicated some low volumes (<300 ng mRNA) but high quality.
Sequencing
Sequencing was performed at the University of Minnesota Genomics Center on an Illumina HiSeq.
Project notes:
- Project was sequenced on a 100bp PE run.
- 24 barcoded libraries prepared with TruSeq RNA V2 library prep. kit. Created 2 pools of 12 libraries and sequenced each pool in a separate lane.
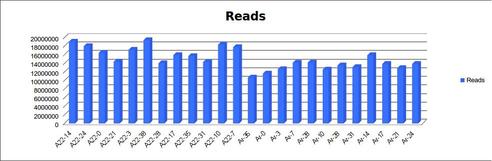
- Delivered greater than 160M reads per lane; 200M reads for A22 and 160 M reads for Ar.
- Average quality scores are well above Q30 for both R1 and R2.
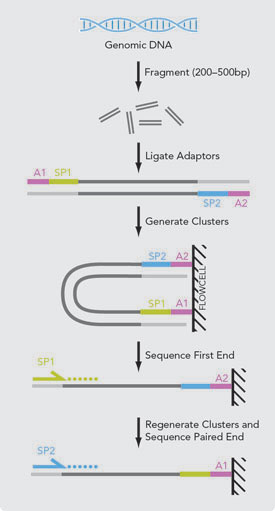
- The libraries were pooled and size selected to generate inserts of approximately 200bp.
General notes on assembly pipeline
Transcriptome assembly with short-read data is more difficult than genome assembly due to (1) highly heterogenous coverage among low and highly expressed transcripts and (2) multiple isoforms existing for any gene. In addition, methods to correct for errors in Illumina data (Kelley et al. 2010) cannot be used as they use coverage to identify errors. A number of programs including Trinity, Oases and SOAPdenovo-trans have been developed to address these changes. The best assembler is unknown as their performance depends on tuning of parameters and characteristics of the unknown genome (Salzberg et al. 2012). Moreover, these programs are memory-intensive, often requiring many hundred GB of RAM and can take days to run, restricting the number of assemblies that can evaluated.
To address these challenges, a number of methods have been recently proposed. I evaluated the use of two methods on assembly:
- Merging of overlapping paired-end reads (Magoč et al. 2011)
- Merging paired-end reads reduces the number of reads in the assembly (thus speeding up assembly) and provides great information in the longer read length of the merged reads.
- Digital normalization of reads (Brown et al. 2012)
- Digital normalization discards all redundant kmers (DNA words of length k) above the median value across all kmers. This greatly increases the speed of assembly by removing ~90-99% of the data. Further, by removing rare kmers after normalization, this method can reduce the Illumina error rate similar to QUAKE (Kelley et al. 2010). Normalization with Trinity reduces full-length transcript reconstruction but has little impact on isoform detection (Haas et al. 2013).
I compared the transcriptomes generated by Oases after pre-processing reads using these two methods in three ways:
1) digital normalization only
| assembly stat | result |
|---|---|
| Total Trimmed Contigs | 126,781 |
| Total Length | 109,476,821 |
| Min contig size | 100 |
| Median contig size | 365 |
| Mean contig size | 863 |
| Max contig size | 14,314 |
| N50 Contig | 16,370 |
| N50 Length | 1,933 |
| N90 Contig | 66,842 |
| N90 Length | 333 |
2) digital normalization followed by merging reads
| assembly stat | result |
|---|---|
| Total Trimmed Contigs | 111,413 |
| Total Length | 111,343,478 |
| Min contig size | 100 |
| Median contig size | 447 |
| Mean contig size | 999 |
| Max contig size | 20,427 |
| N50 Contig | 15,236 |
| N50 Length | 2,163 |
| N90 Contig | 58,158 |
| N90 Length | 410 |
3) merging reads followed by digital normalization
| assembly stat | result |
|---|---|
| Total Trimmed Contigs | 90,612 |
| Total Length | 86,485,229 |
| Min contig size | 119 |
| Median contig size | 586 |
| Mean contig size | 954 |
| Max contig size | 14,006 |
| N50 Contig | 16,436 |
| N50 Length | 1506 |
| N90 Contig | 60,314 |
| N90 Length | 396 |
Assembly generated by merging reads and then digital normalization had 30% fewer contigs, but longer contig length.
Below, I describe the steps in my transcriptome assembly pipeline in more detail:
- Quality control of reads
- Processing for assembly
- Assembly
- Evaluate assembly using in silico spike-in
- Reduction of transcripts
- Map reads to transcriptome for expression
However, prior to assembling our true data, I performed a simulation to evaluate the assembly method and serve as a template for including an in silico spike-in of reads in the true assembly
Simulation
I downloaded 1000 mRNA transcripts from Arabidopsis thaliana which are unlikely to be related to any Aphaenogaster transcripts. I generated simulated expression levels and fragmentation of the reads that occurs during the Illumina library prep process using rlsim. I then followed the transcriptome assembly pipeline as described above with these reads. As I was not able to run a full (not normalized) assembly with all data, I also explored this approach.
Final results were encouraging, with 58% and reads recovered using all data and 70% with digitally-normalized data. Both methods covered 90% of the length of the recaptured transcripts. However, multiple isoforms (about 2 per transcript) were inferred though they did not truly exist.
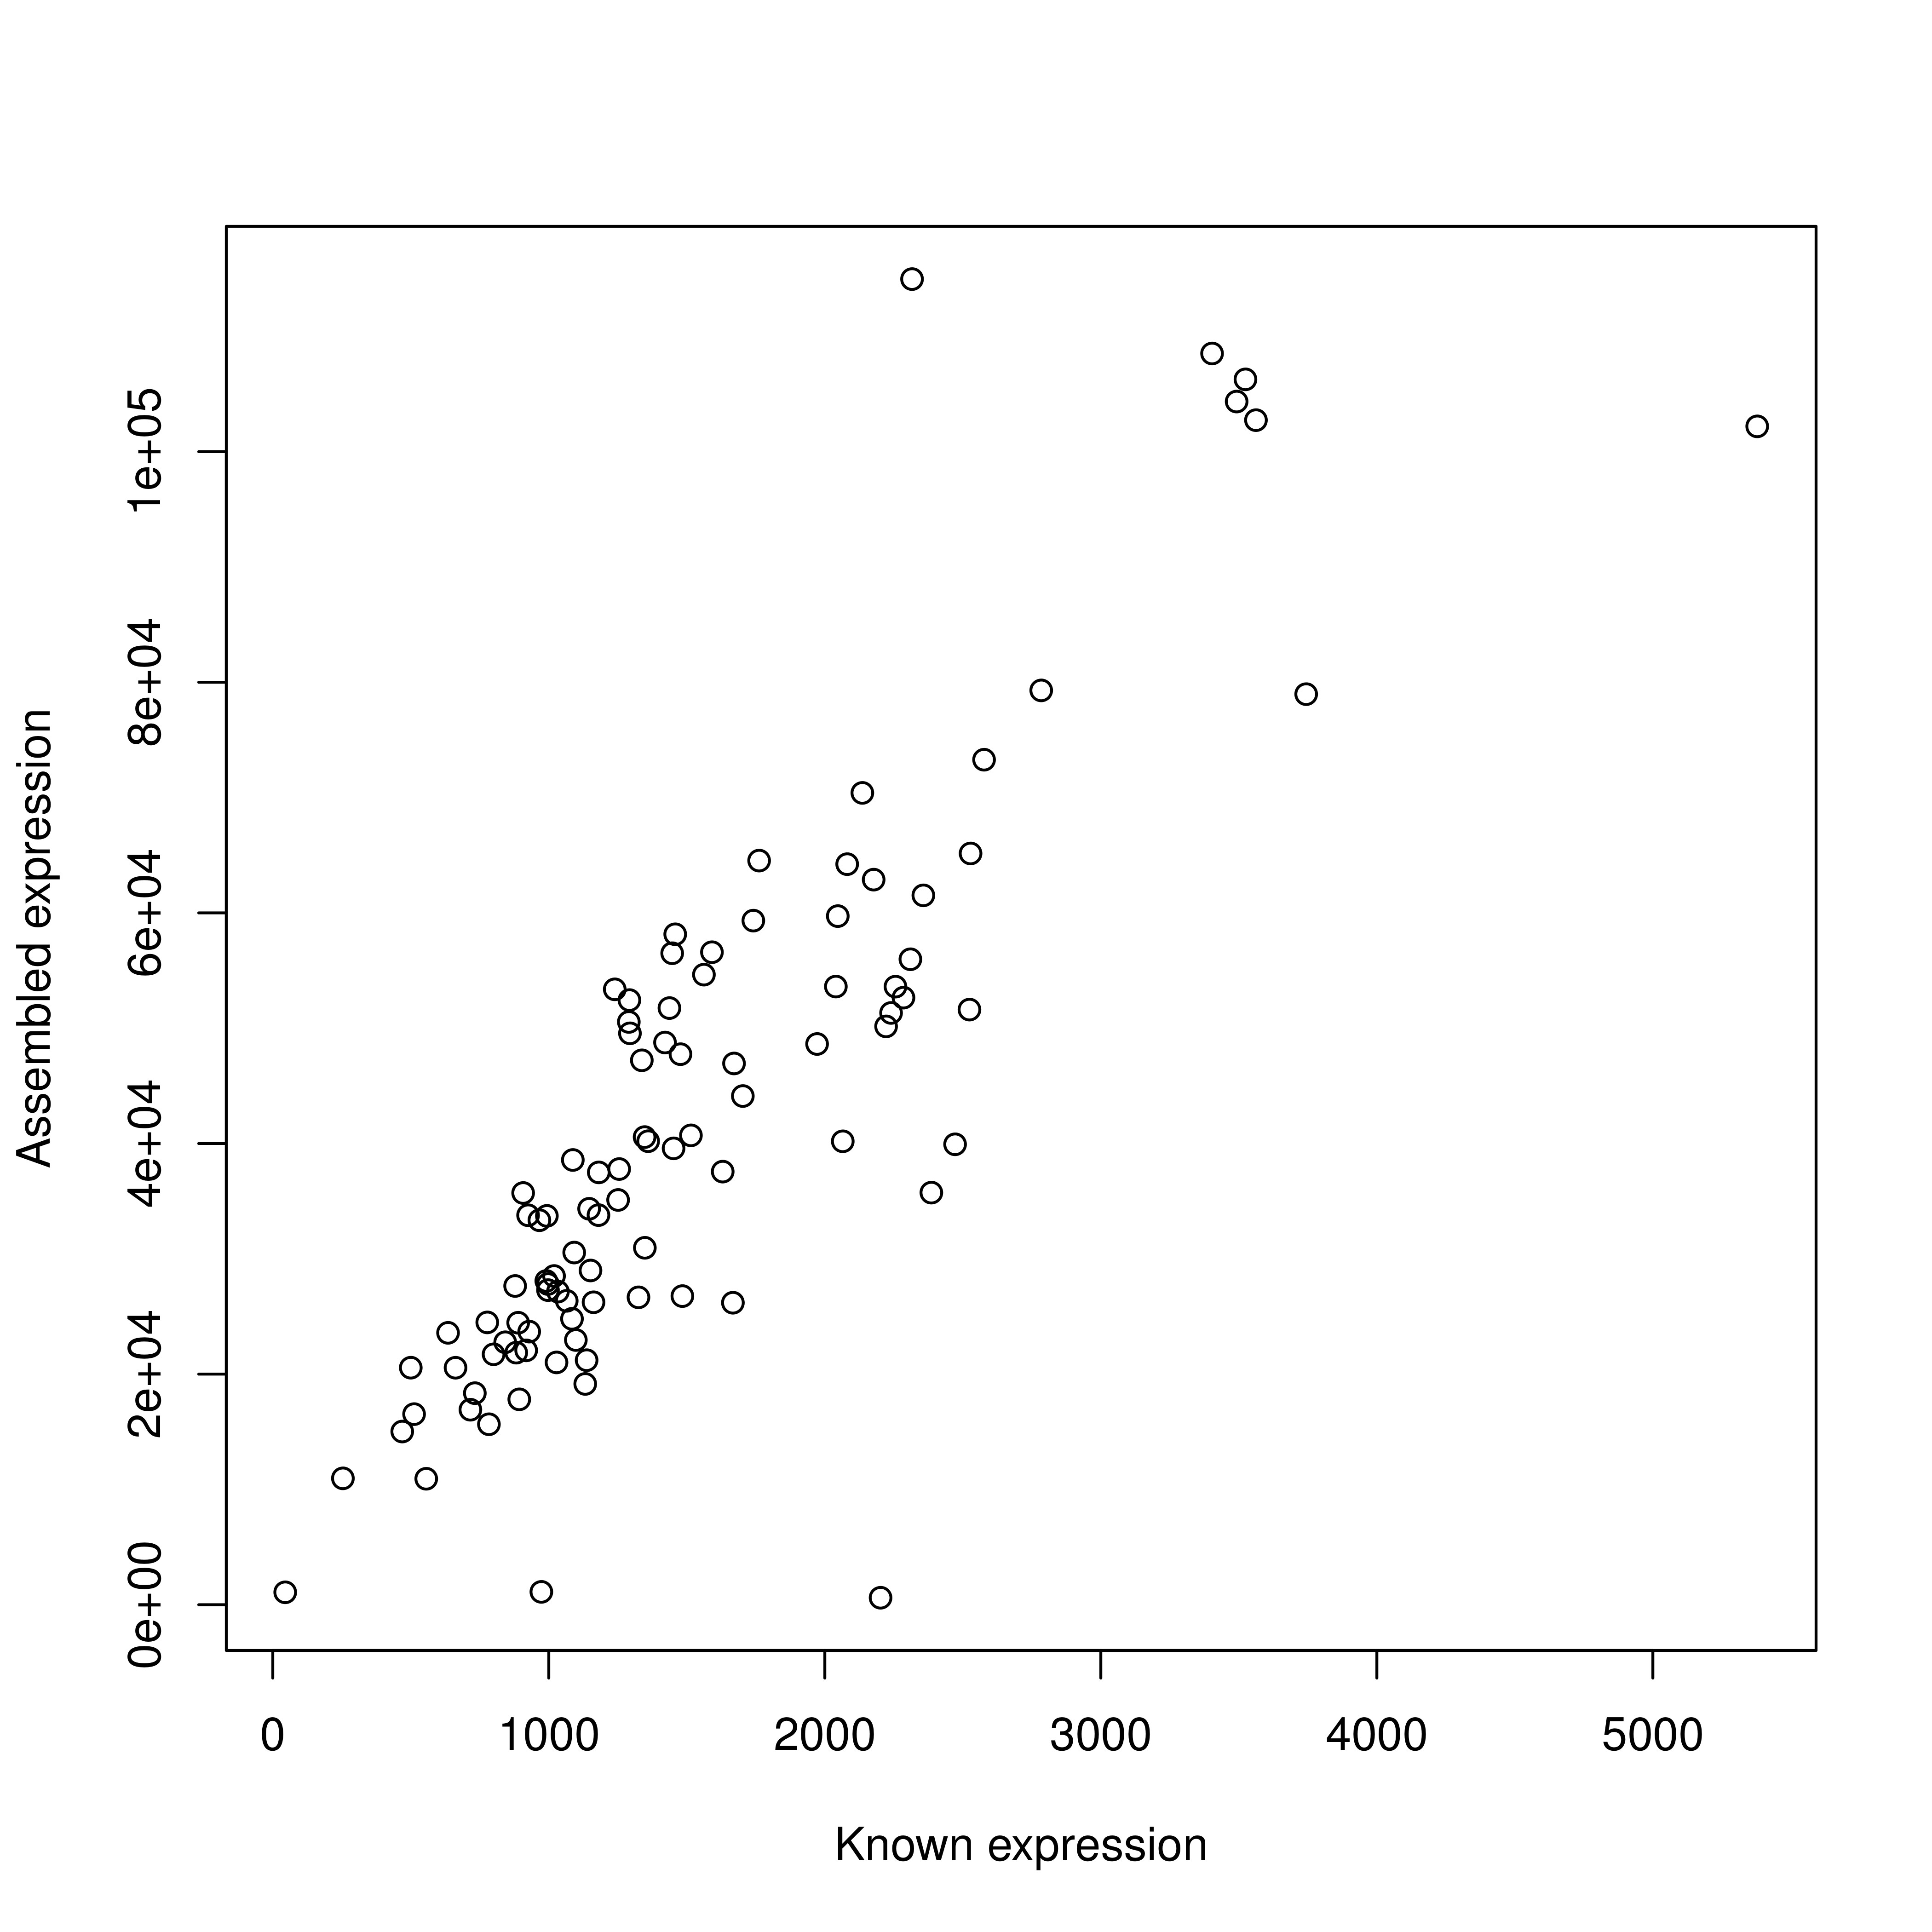
I evaluated gene expression using two standard approaches (cufflinks and BWA) as well as a new mapping-free alignment approach (sailfish). I found all three to perform very well with greater than 90% correlation to the known simulated expression levels.
Transcriptome Assembly
Quality control
Illumina reads were trimmed for Illumina adapters and filtered to remove low quality base pairs using trim_galore. 02-A22-TrimClip.sh script in project repository.
Reports available here
In total, about 4% of bases filtered due to quality.
Paired-end read merging
As the mRNA library was size selected to an insert size of 200bp and 100bp sequencing was performed, overlap in sequencing is likely to occur for any fragments shorter than 200bp with full length sequencing. To take advantage of this, I used the program FLASH (Magoc and Salzberg 2011).
Digital normalization
To capture transcripts with low expression levels, I targeted coverage of 100x in each sample. Moreover, in each lane there were 12 samples. Thus with the expectation of a transcriptome size of 17k genes times of median length 1000 bp, our expected coverage is 1882 ( 160M reads * 200 bp / (17000 genes * 1000 bp) ). Digital normalization systematizes coverage by discarding redundant data without influencing transcriptome assembly (Brown et al. 2013). As all reads are mapped to the assembled transcriptome, this does not influence gene expression analysis.
I performed digital normalization using the normalize-by-median.py program of the khmer libraryq (Brown et al. 2013). Rare kmers were then removed using filter-abund.py
Assembly
Assembly was performed on the merged and digitally-normalized transcripts using both Oases and Trinity. To evaluate the quality of the assembly, at the start of the pipeline I included simulated mRNA seq reads from 100 Arabidopsis mRNA transcripts and thus each assembly includes about 100 more transcripts than true. These known transcripts will be used to evaluate assembly and then removed.
Assembly stats for Oases
| assembly stat | result |
|---|---|
| Total Trimmed Contigs | 104,783 |
| Total Length | 99,167,303 |
| Min contig size | 100 |
| Median contig size | 442 |
| Mean contig size | 946 |
| Max contig size | 18,563 |
| N50 Contig | 14,654 |
| N50 Length | 1,986 |
| N90 Contig | 56,313 |
| N90 Length | 386 |
Assembly stats for Trinity
| assembly stat | result |
|---|---|
| Total Trimmed Contigs | 94,882 |
| Total Length | 96,307,666 |
| Min contig size | 201 |
| Median contig size | 461 |
| Mean contig size | 1,015 |
| Max contig size | 16,473 |
| N50 Contig | 13,617 |
| N50 Length | 2,045 |
| N90 Contig | 57,695 |
| N90 Length | 351 |
Evaluation of assembly
BLAST to these known transcripts to evaluate number of known transcripts recovered, proportion of their length recovered, and the number of isoforms inferred per transcript.
TODO - all results below are for Oases assembly only
Transcript reduction
Simulation results with only simulated reads revealed that many false isoforms were inferred, about 2 per true transcript. With real data, some of the alternative transcripts are true, while others are incorrectly inferred. This can influence read mapping as reads will be split among transcripts.
Based on related ant genomes, I expected 17k genes, but the results yield about 90k transcripts. While many are likely true, this excessive number of transcripts is consistent with the simulation results of false isoforms being inferred. Choosing a final assembly is a balance between keeping true isoforms and removing false ones. To To address this, I used the CAP3 assembler that clusters reads with significant overlap. I changed the default settings to only cluster reads with less than 80 bp gap, at least 40 bp overlap and 95% sequence similarity in the overlap region. This clustered 42,765 transcripts into 11,926 contigs and 62,018 singlets, resulting in a total of 73,943 transcripts.
| assembly stat | result |
|---|---|
| Total Trimmed Contigs | 73,943 |
| Total Length | 60,773,272 |
| Min contig size | 100 |
| Median contig size | 364 |
| Mean contig size | 821 |
| Max contig size | 18,839 |
| N50 Contig | 9,743 |
| N50 Length | 1,801 |
| N90 Contig | 39,904 |
| N90 Length | 318 |
Gene expression
As the simulation results showed similar performance, I used sailfish for fast alignment of reads to the transcriptome(Patro et al. 2013). Sailfish generates “Transcripts per million” which are the the number of read tags mapped to a region divided by the sum of all length normalized tag counts. This gist shows an example calculation of TPM compared to the more-frequently used by inconsistent eReads per Kilobase per Million Transcripts (RPKM). Sailfish further corrects TPM for biases due to GC-content and transcript length.
I individually mapped reads from each sample to the assembled transcriptome. For each transcripts, I then fit a polynomial regression:
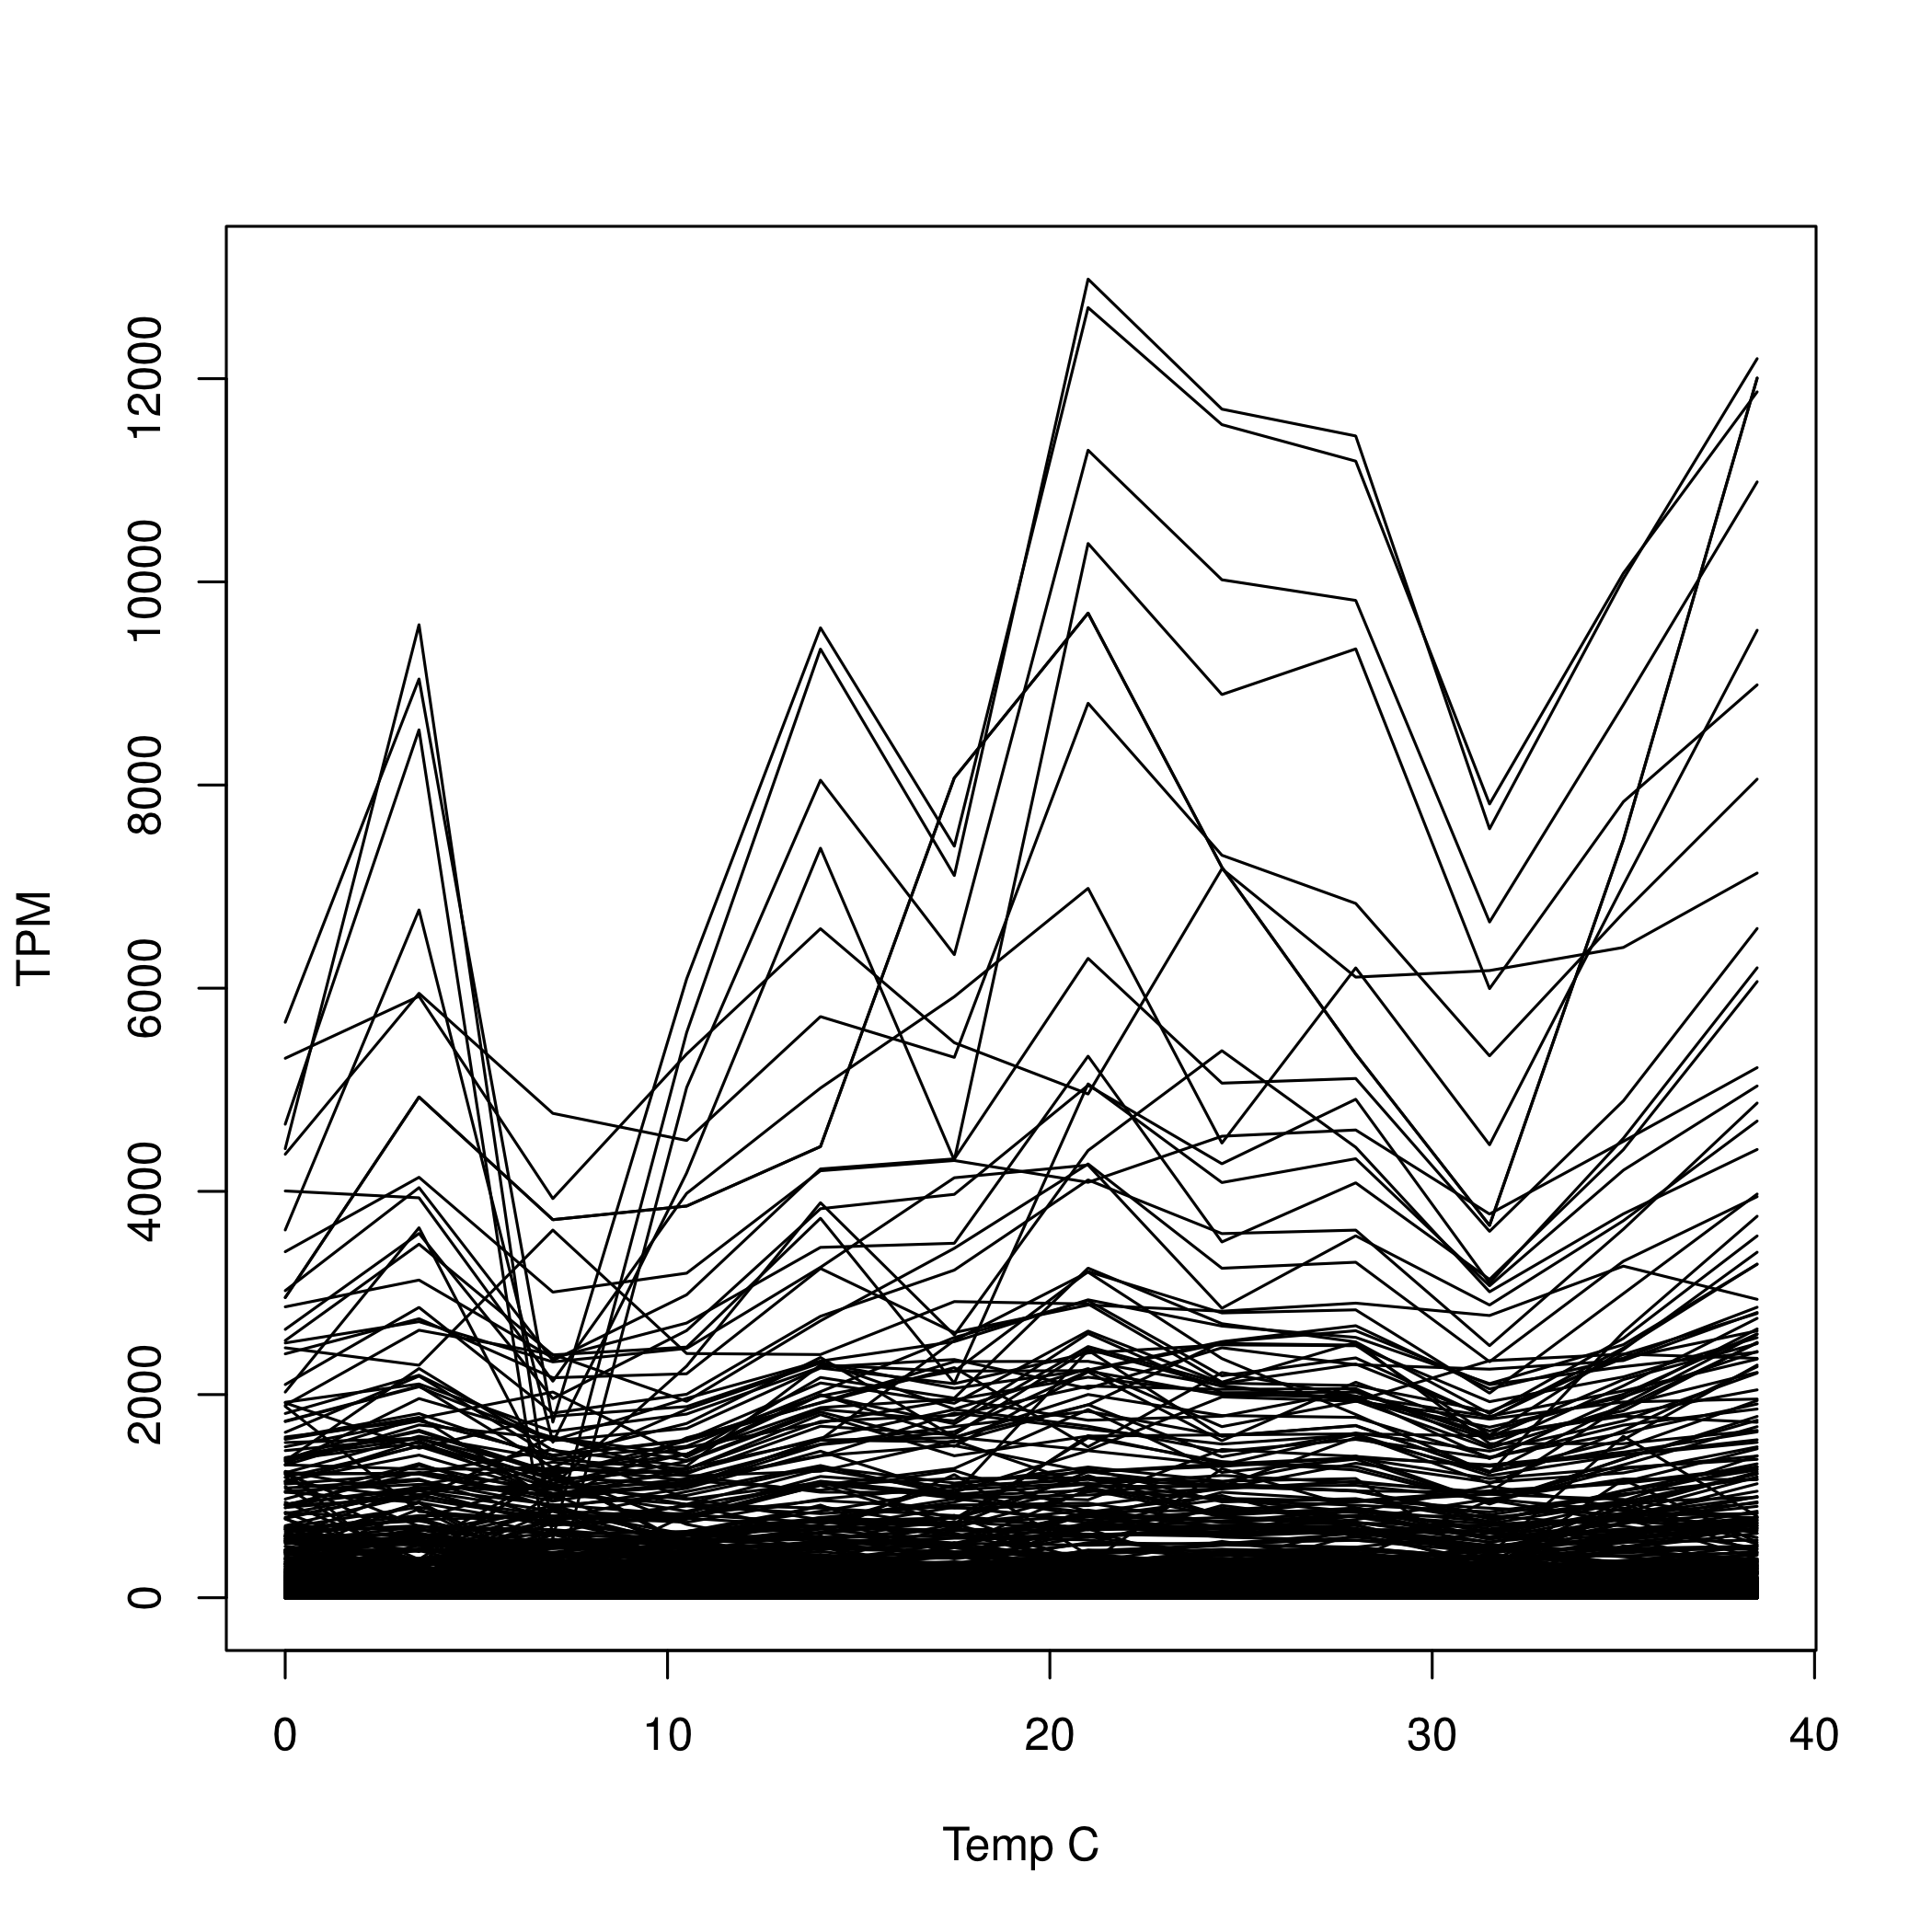
TPM ~ temp + temp^2and retained transcripts that had a significant linear or quadratic term at the liberal value of alpha = 0.05. TODO - null distribution for each transcript.
11,274 Of the 73,943 transcripts in the assembly (15%) had either a significant linear or quadratic term at P<0.05 (Figure 3).
References
Brown, C.T., Howe, A., Zhang, Q., Pyrkosz, A.B. & Brom, T.H. (2012). A Reference-Free Algorithm for Computational Normalization of Shotgun Sequencing Data. arXiv:1203.4802.
Haas, B.J., Papanicolaou, A., Yassour, M., Grabherr, M., Blood, P.D., Bowden, J., Couger, M.B., Eccles, D., Li, B., Lieber, M., MacManes, M.D., Ott, M., Orvis, J., Pochet, N., Strozzi, F., Weeks, N., Westerman, R., William, T., Dewey, C.N., Henschel, R., LeDuc, R.D., Friedman, N. & Regev, A. (2013). De novo transcript sequence reconstruction from RNA-seq using the Trinity platform for reference generation and analysis. Nature Protocols, 8, 1494–1512.
Kelley, D.R., Schatz, M.C. & Salzberg, S.L. (2010). Quake: quality-aware detection and correction of sequencing errors. Genome Biology, 11, R116.
Magoč, T. & Salzberg, S.L. (2011). FLASH: Fast Length Adjustment of Short Reads to Improve Genome Assemblies. Bioinformatics.
Patro, R., Mount, S.M. & Kingsford, C. (2013). Sailfish: Alignment-free Isoform Quantification from RNA-seq Reads using Lightweight Algorithms. arxiv:1308.3700
Salzberg, S.L., Phillippy, A.M., Zimin, A., Puiu, D., Magoc, T., Koren, S., Treangen, T.J., Schatz, M.C., Delcher, A.L., Roberts, M., Marccais, G., Pop, M. & Yorke, J.A. (2012). GAGE: A critical evaluation of genome assemblies and assembly algorithms. Genome Research, 22, 557–67.
