GO semantic similarity
- Aphaenophone
- AE inquired about status of Aphaenogaster genome
- need to collect colony from Molly Bog and extract gDNA for PacBio!
- deferred next meeting until August due to busy field schedules
- Identified three ant species working with NG and Field Guide to the Ants of New England
- Tapinoma sessile collected from top of Stowe Pinnacle VT
- Prenolepsis imparis collected by NG from Shelburne VT
- Aphaenogaster picea collected from East Woods, Burlington VT. confirmed what I knew…
- Centennial ms
- Started DNA extraction for 20 Aphaenogaster from East Woods for ddRADseq round 3
ApTranscriptome
From my work over past few days, have discovered two major issues with using DAVID through the RDAVIDWebService R/Bioconductor package.
- RDAVIDWebService incorrectly gives value of 1.000 for many, but not all, gene clusters.
- Database was last updated in 2009
Regarding (1), I emailed the developer and he quickly responded that he would look into it. It’s straight-forward to manually calculate the correct Enrichment score, but a bit odd that this problem occurs nonetheless. Also, I can’t replicate the exact results running the same files on the DAVID web interface, though many of the same clusters do appear.
Issue (2) of the database is a larger problem. Annecdotal discussion on biostars [suggests][https://www.biostars.org/p/9394/#9401] this is a problem.
At this point - my thoughts are to give up on DAVID.
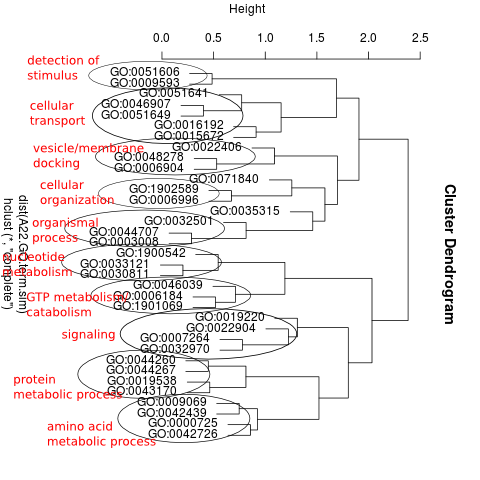
To get the main benefits of the DAVID analysis, clustering of related terms, I continued with clustering related GO terms using GOSemSim R/Bioconductor package as yesterday
Specifcally, I calculated the semantic similarity among all GO terms for an enriched category (e.g. High genes), calculated the distance among terms, and then plotted.
I was then able to assign a functional name to each cluster of related-GO terms. For example, here’s the clustering of A. picea High genes:
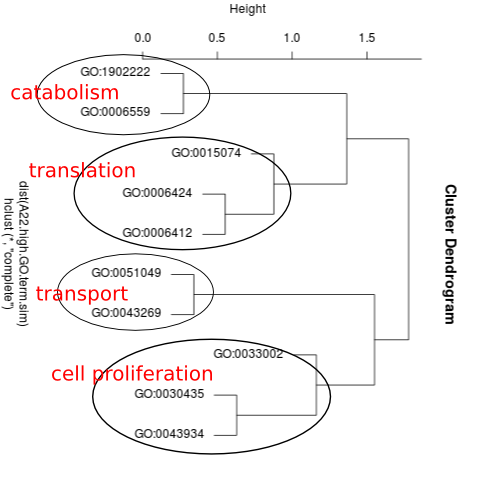
and here’s the clustering for A. picea Low genes: